


一、基本介绍
1、prometheus
Prometheus(普罗米修斯)是一套开源的监控&报警&时间序列数据库的组合,由 SoundCloud 公司开发。
2、Grafana
Grafana 是一款开源的数据可视化工具,可以从多种数据源获取数据,并在美观、灵活的数据面板中创建、探索和共享所有数据。
3、exporter
被监控的服务器数据采集程序,通过该程序可以将相关数据发送到prometheus
4、基本逻辑
被监控的服务器,通过exporter将数据发定时收集好到prometheus,然后通过Grafana进行可视化呈现和预警。
二、环境搭建
1、准备3台服务器
这里虚拟机的搭建可以参考我如下几篇笔记
安装VMware15
CentOS7镜像官网下载
VMWare安装CentOS7超全图解
最小系统Centos7进行网络配置以及 ifconfig和vim的安装
VMWare 克隆Linux虚拟机
root forever###用来安装prometheus服务1、192.168.192.20 prometheus-server20###用来安装被监控的应用,这里安装mysql2、192.168.192.19 prometheus-agent19###用来安装grafana3、192.168.192.22 prometheus-grafana22
记得测试的话关闭防火墙,不然本地浏览器访问不了
systemctl stop firewalld
2、prometheus服务的安装
去官网下载
https://prometheus.io/download/
[root@localhost ~]# archx86_64
不要求很严格的情况下:
amd64=x86_64=x64!=IA64

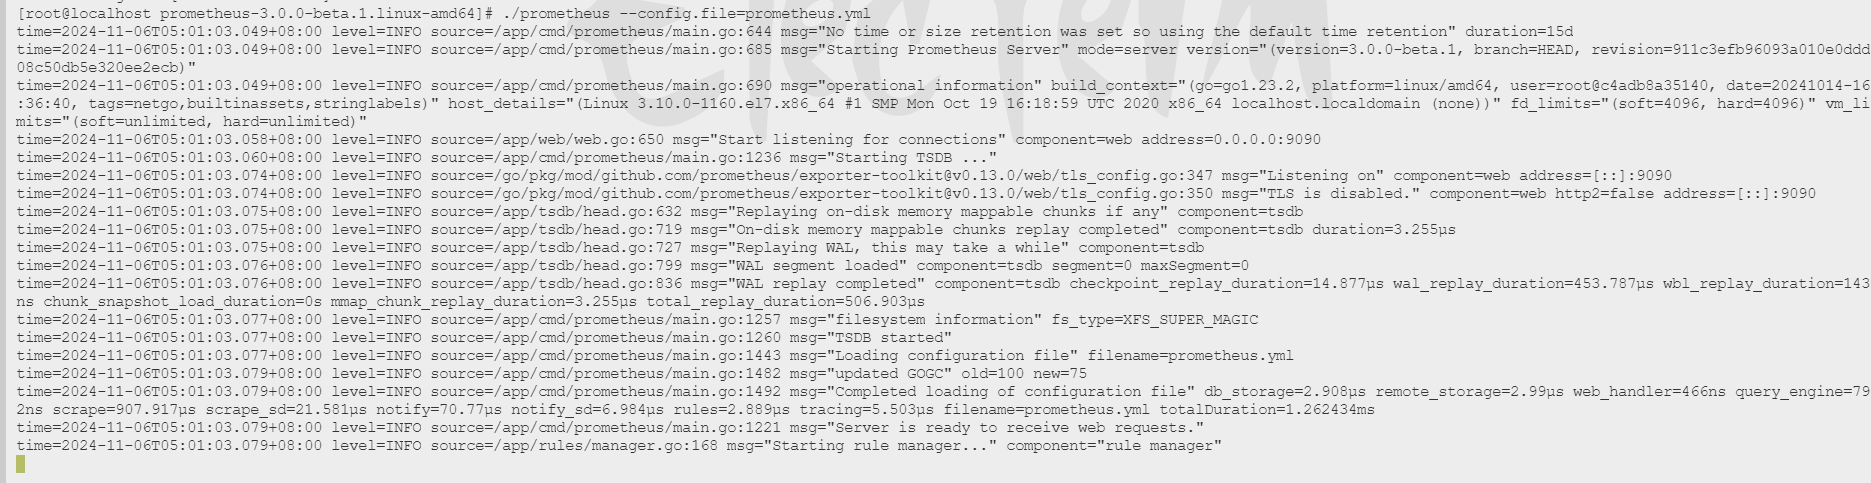
cd /usr/local/tar xvfz prometheus-3.0.0-beta.1.linux-amd64.tar.gzcd prometheus-3.0.0-beta.1.linux-amd64nohup ./prometheus --config.file=prometheus.yml &
这里需要做服务器之间的时钟同步
3、安装node_exporter
使用prometheus监控远程linux主机
1、安装node组件
在远程linux主机上安装node_exporter组件,这样promuthues就可以接收数据了。
https://prometheus.io/download/
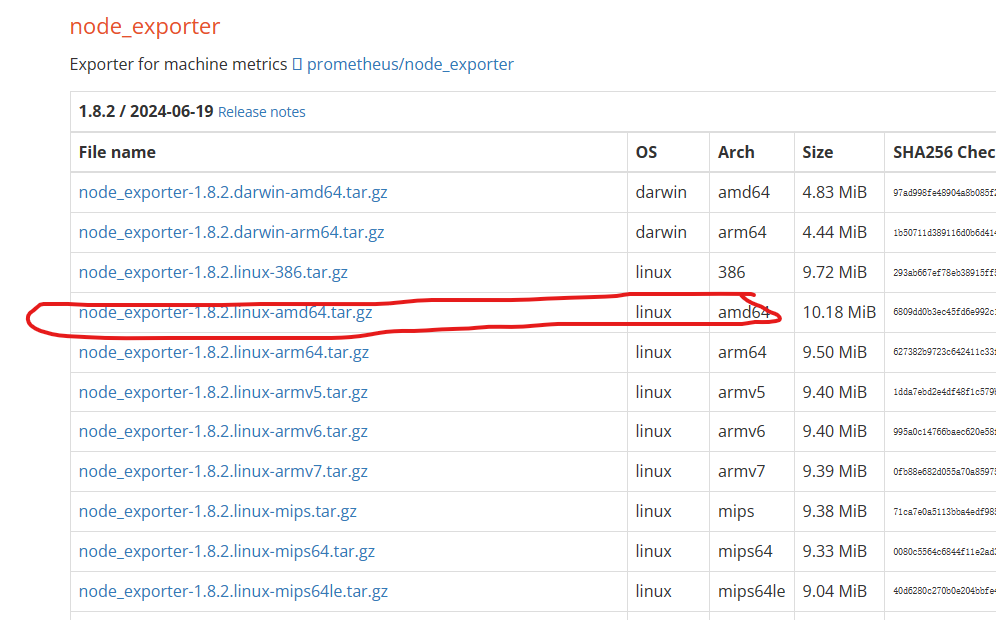
tar zxvf node_exporter-1.8.2.linux-amd64.tar.gzcd node_exporter-1.8.2.linux-amd64nohup ./node_exporter &cat nohup.outts=2024-11-05T14:36:18.462Z caller=tls_config.go:313 level=info msg="Listening on" address=[::]:9100ts=2024-11-05T14:36:18.462Z caller=tls_config.go:316 level=info msg="TLS is disabled." http2=false address=[::]:9100
http://192.168.192.21:9100/metrics
可以看到很多数据了
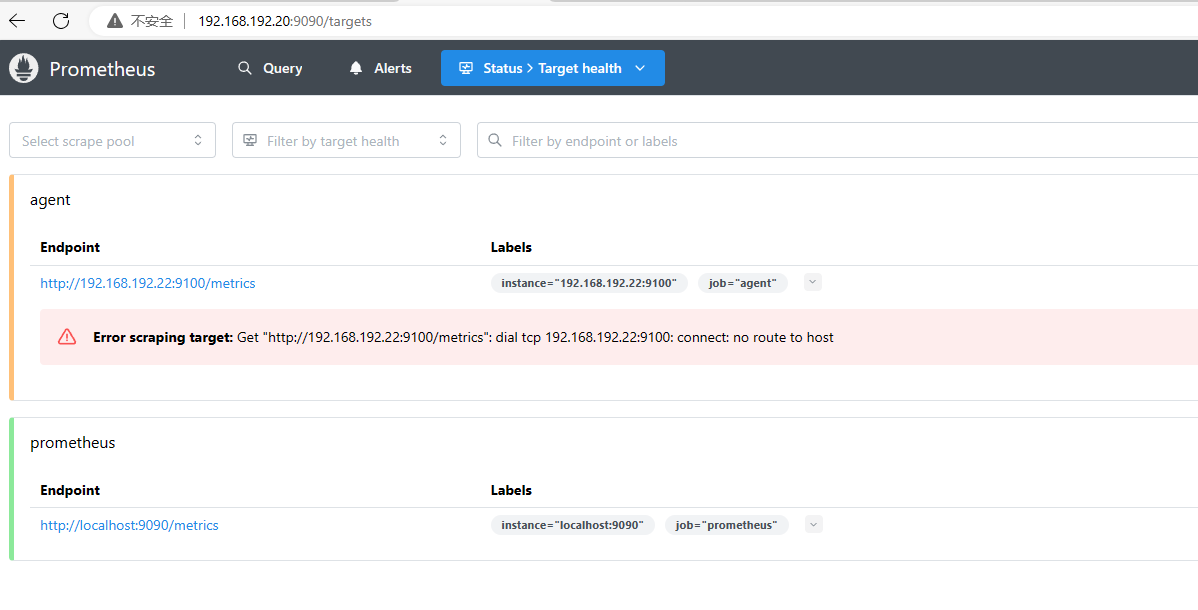
修改prometheus的配置后重启,把该节点加入到服务中
# A scrape configuration containing exactly one endpoint to scrape:# Here it's Prometheus itself.scrape_configs:# The job name is added as a label `job=<job_name>` to any timeseries scraped from this config.- job_name: "prometheus"# metrics_path defaults to '/metrics'# scheme defaults to 'http'.static_configs:- targets: ["localhost:9090"]- job_name: "agent"static_configs:- targets: ["192.168.192.21:9100"]
重启
nohup ./prometheus --config.file=prometheus.yml &
4、安装mysqld_exporter
先安装mysql,这里直接用docker安装
https://www.suibibk.com/topic/583366613781184512
然后下载
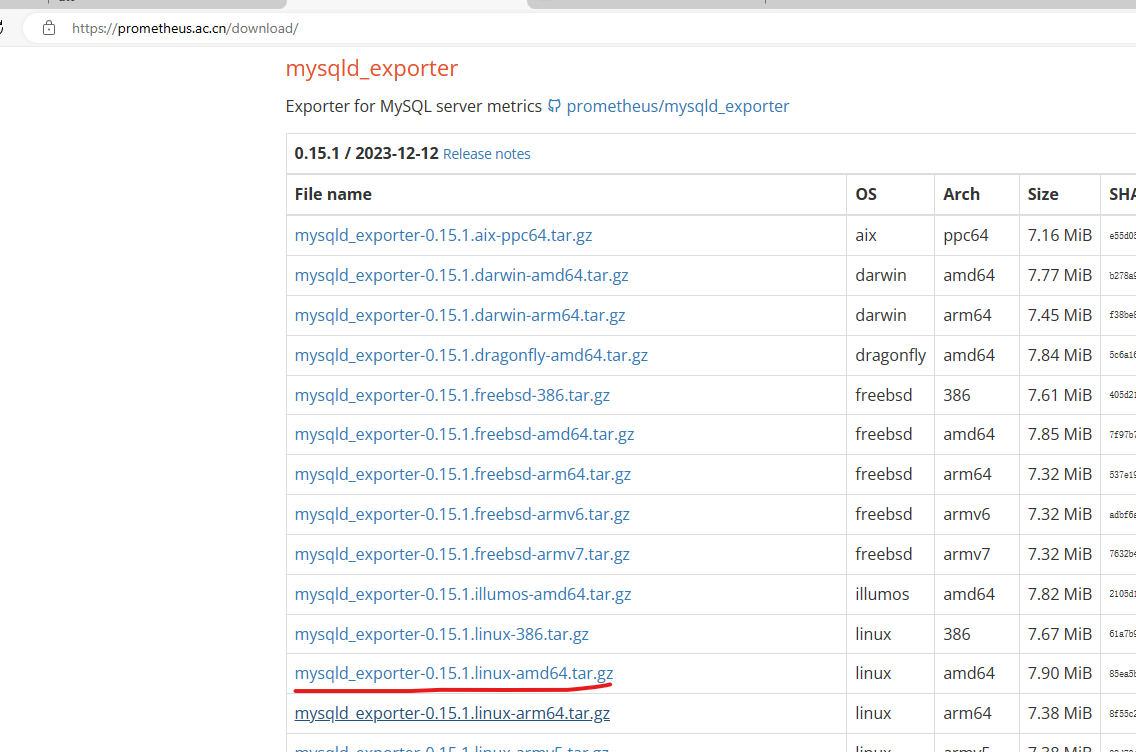
上传到服务器
tar zxvf mysqld_exporter-0.15.1.linux-amd64.tar.gz
cd mysqld_exporter-0.15.1.linux-amd64vi my.cnf####[client]user = rootpassword = 123456host = 192.168.192.19port = 3309
nohup ./mysqld_exporter --config.my-cnf=my.cnf &
打开日志可以看到端口为9104
http://192.168.192.19:9104/metrics
修改Prometheus的配置文件
- job_name: "mysql"static_configs:- targets: ["192.168.192.19:9104"]
然后重启,访问即可发现
http://192.168.192.20:9090/targets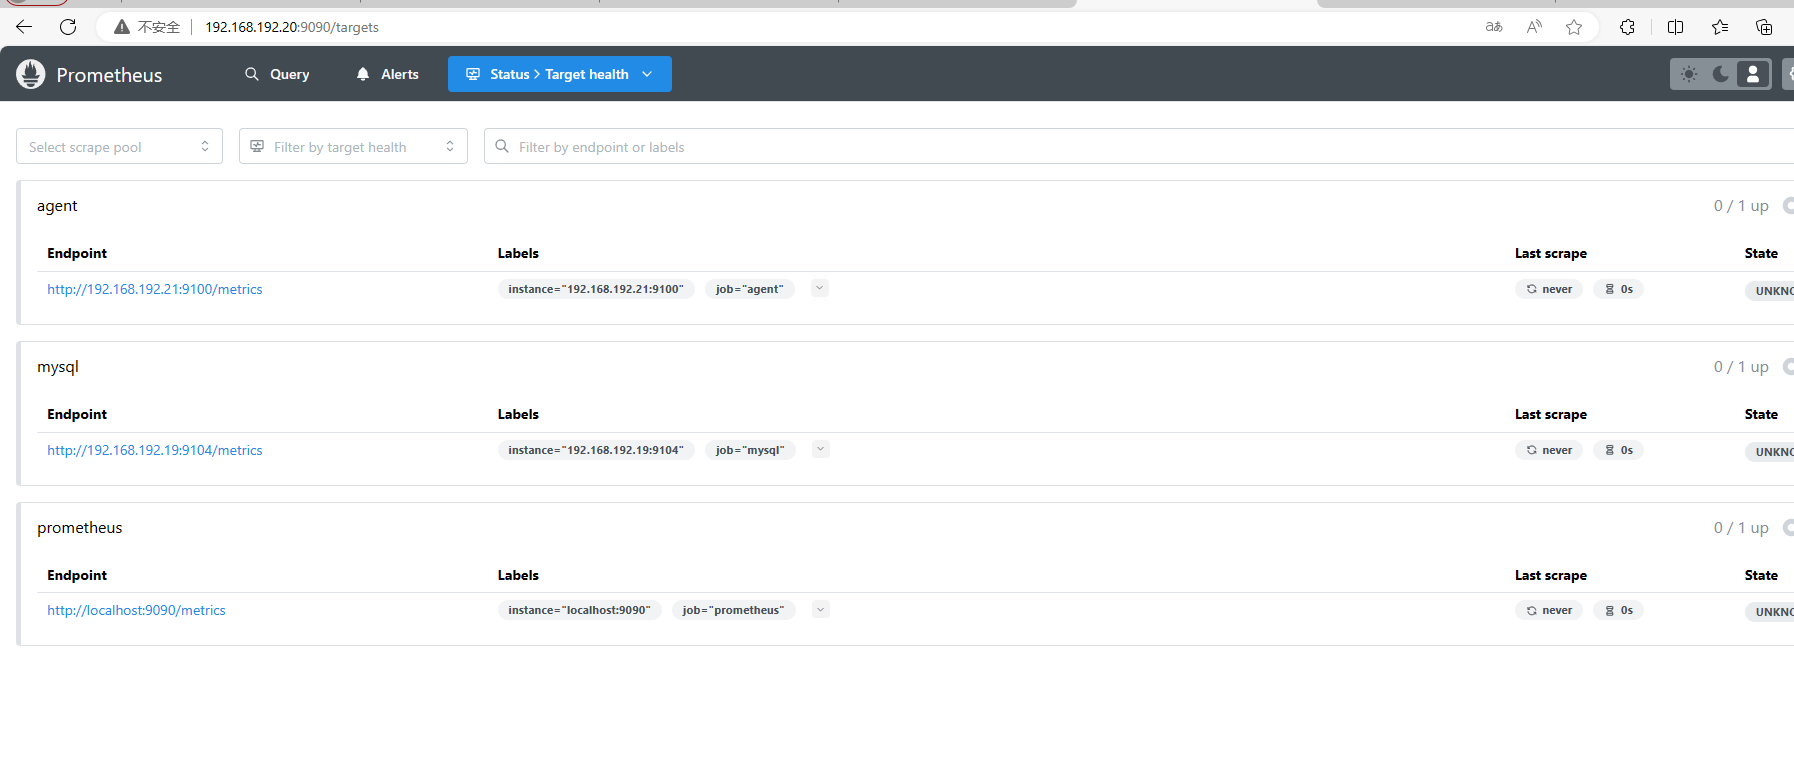
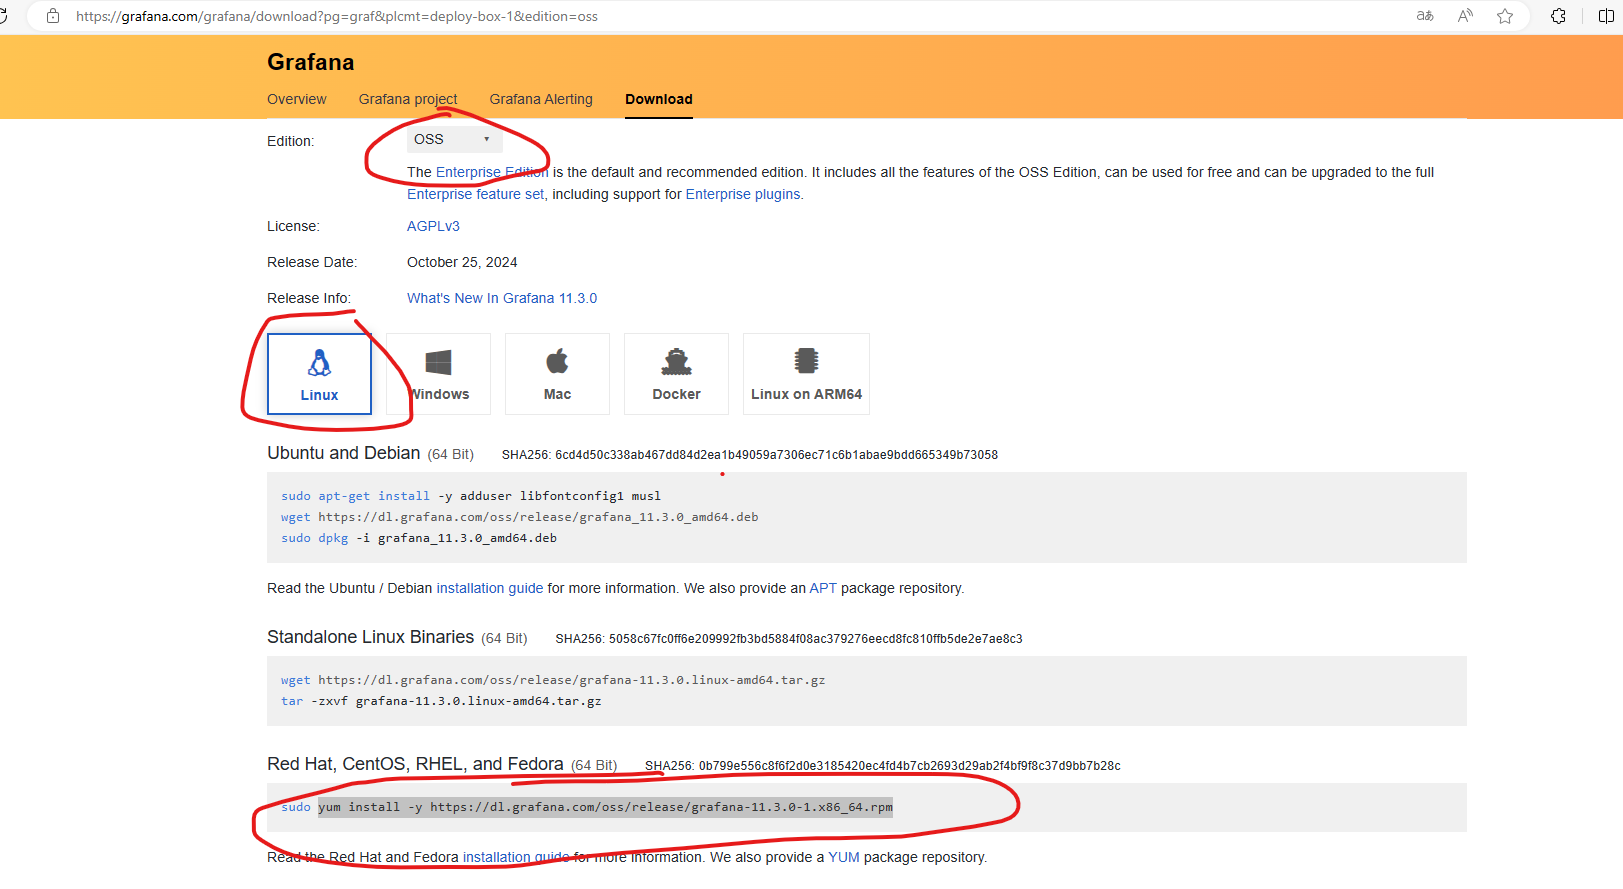
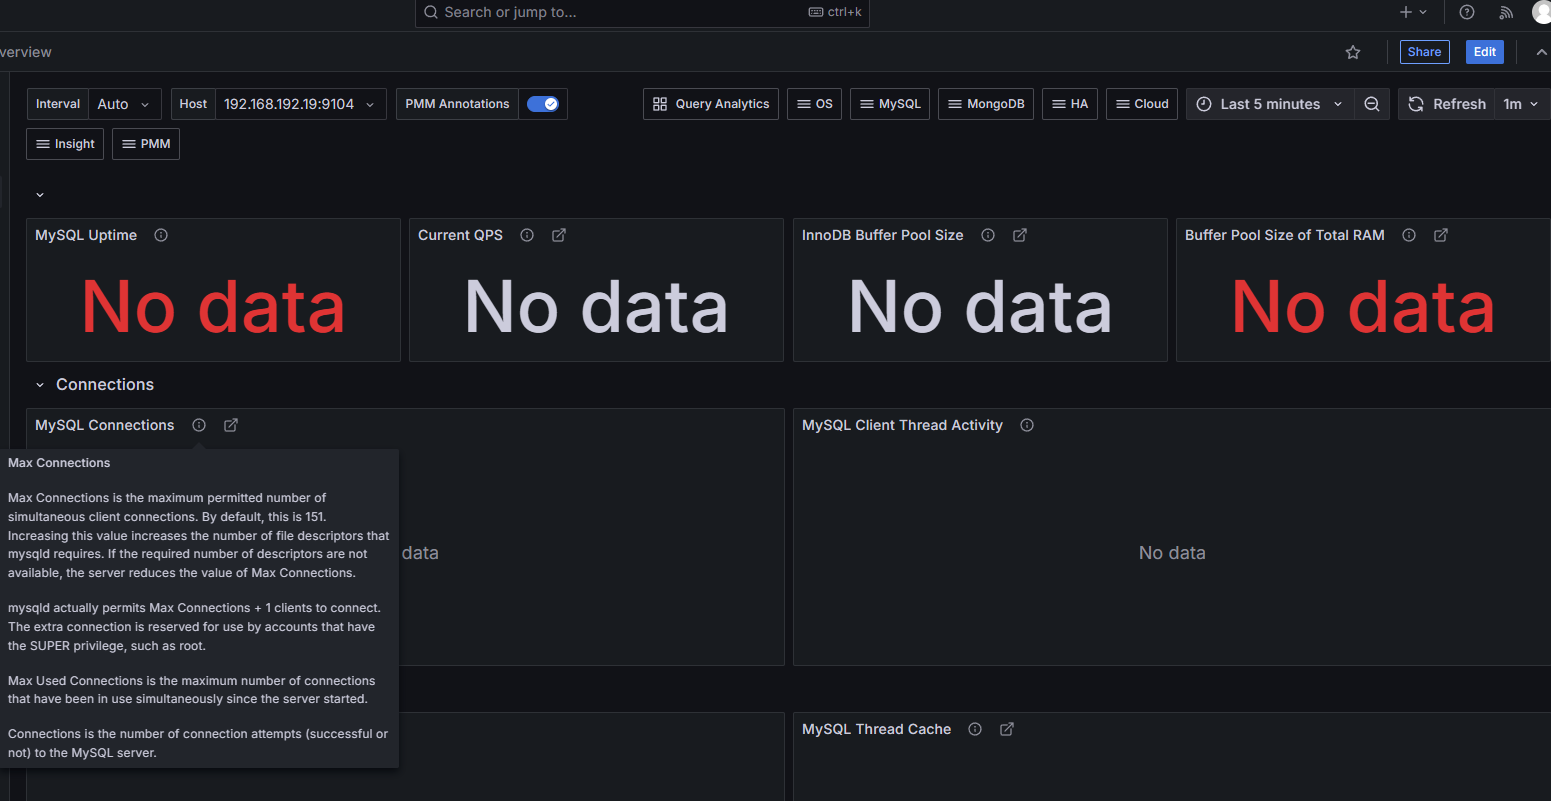
5、安装grafana
yum install -y https://dl.grafana.com/oss/release/grafana-11.3.0-1.x86_64.rpm

systemctl start grafana-serversystemctl enable grafana-server
端口是3000,这个可以从官网上找到
https://grafana.com/docs/grafana/latest/getting-started/build-first-dashboard/
用户密码都是admin
登录后密码我这里是改为了123456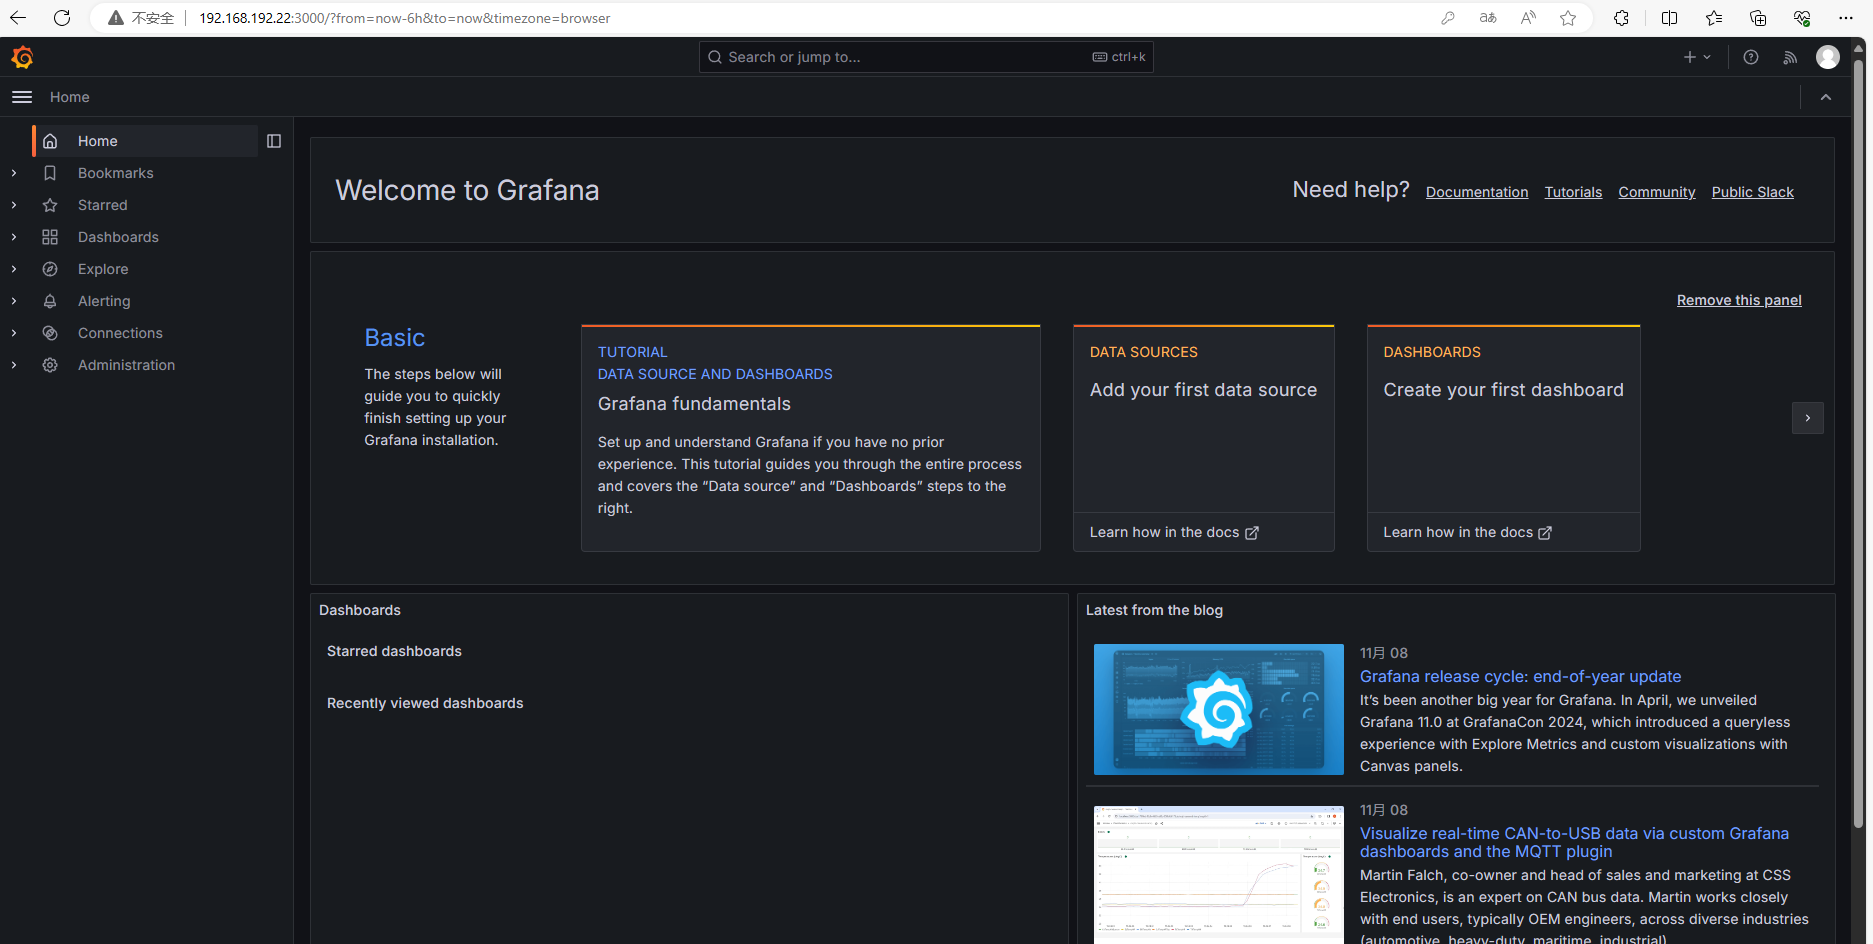
先加个数据源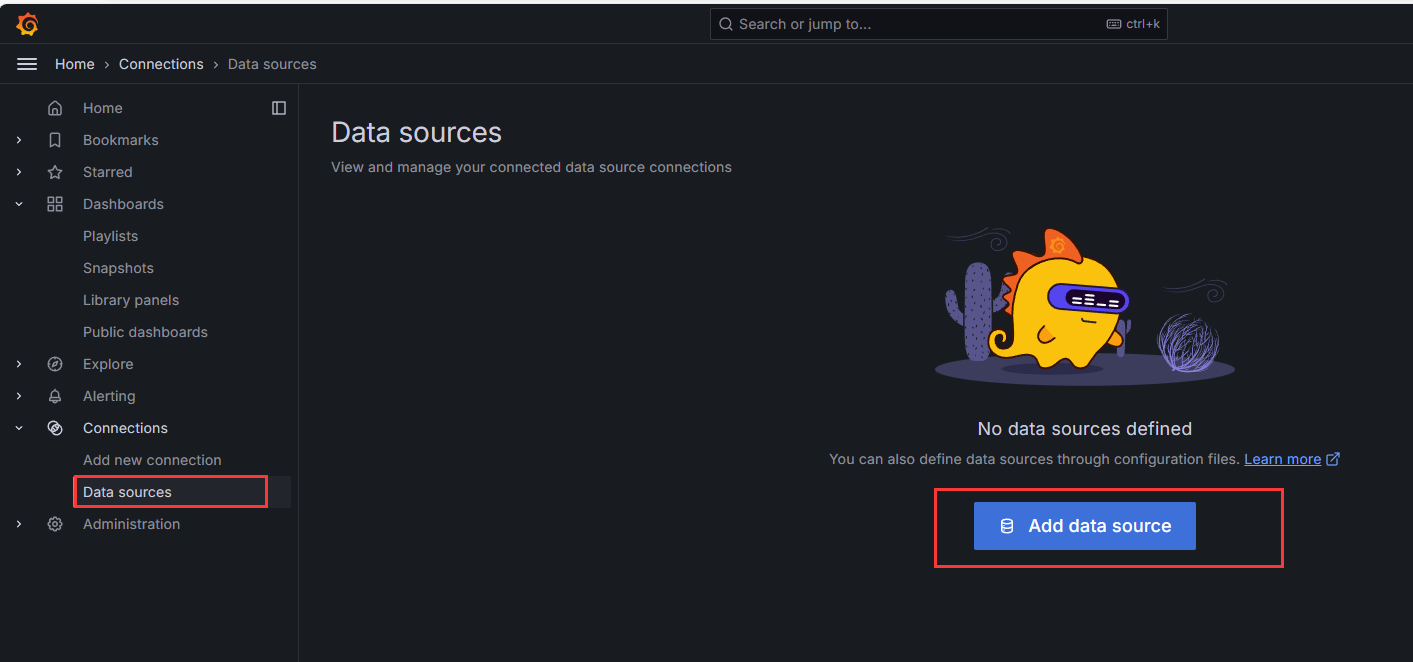
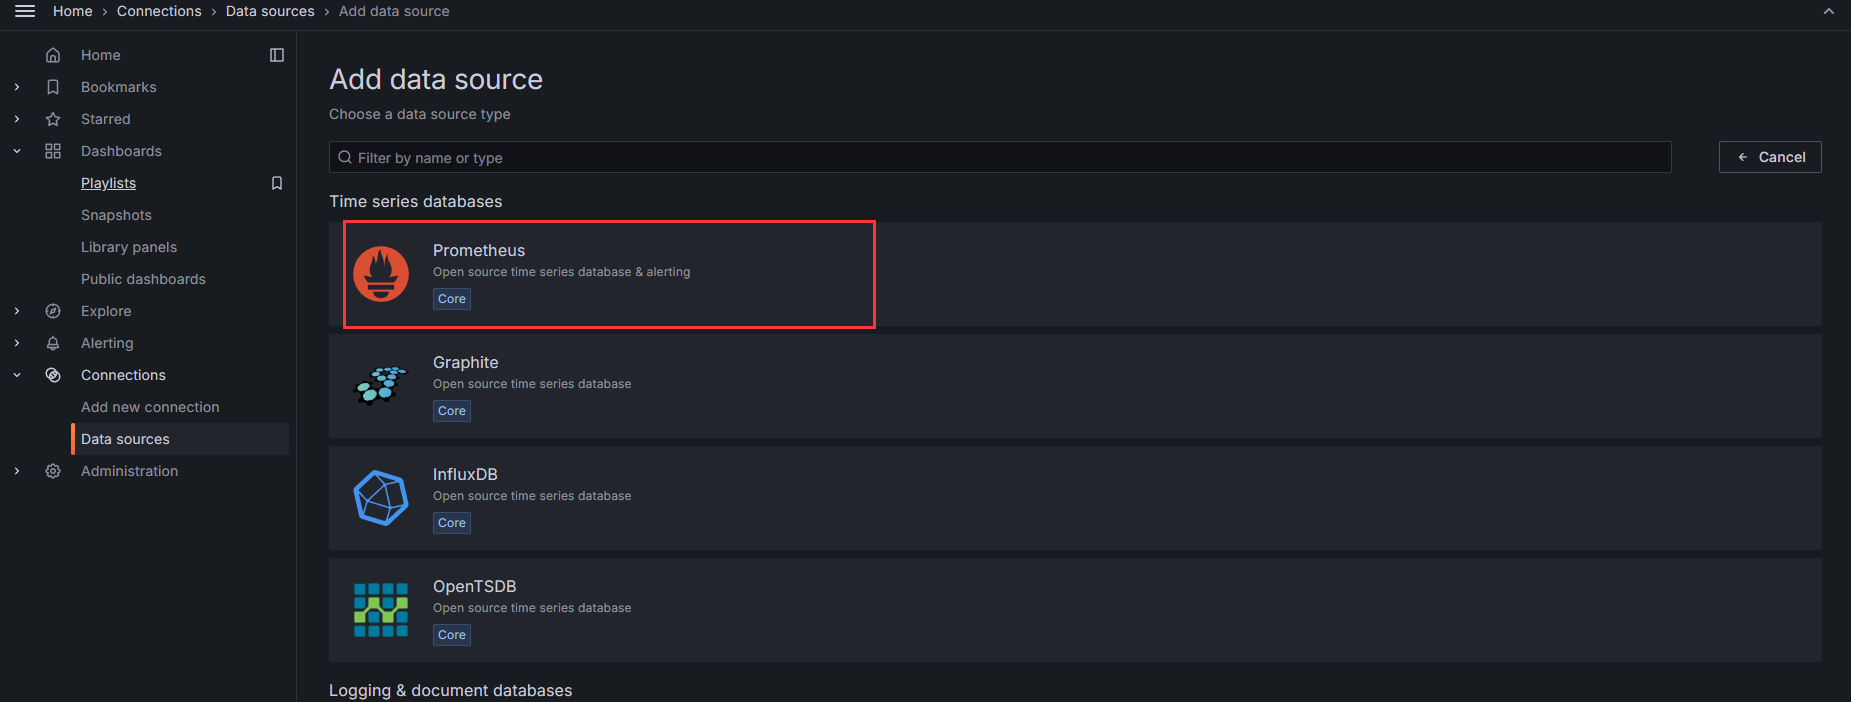
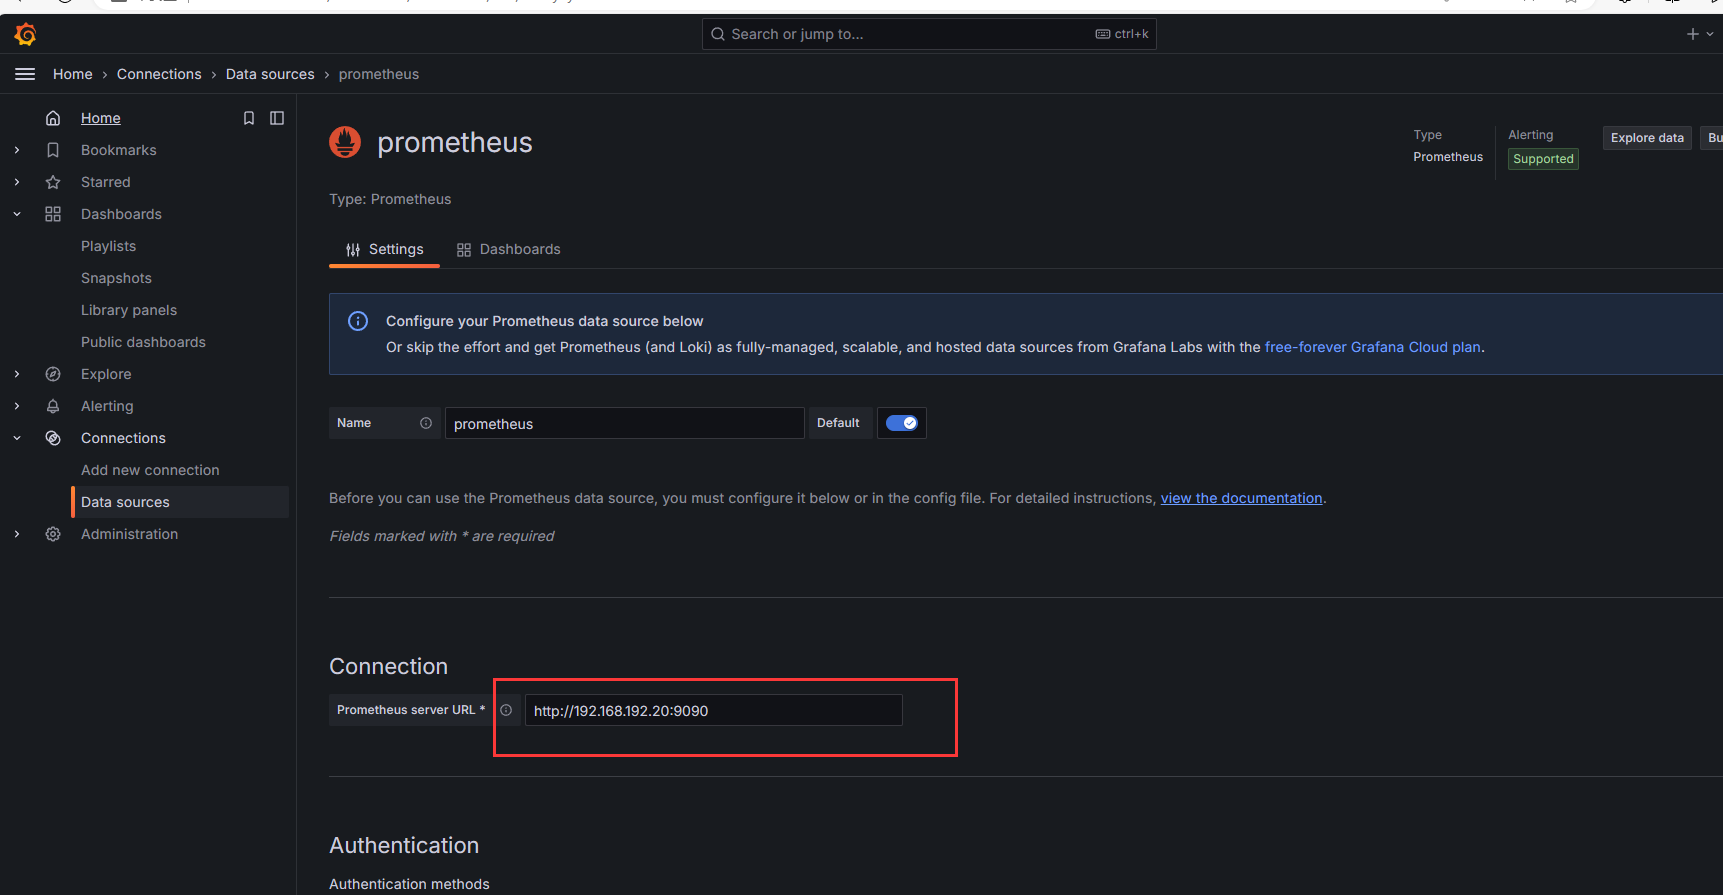
啥我都不改,都用默认的,就加上我的普罗米修斯的地址即可
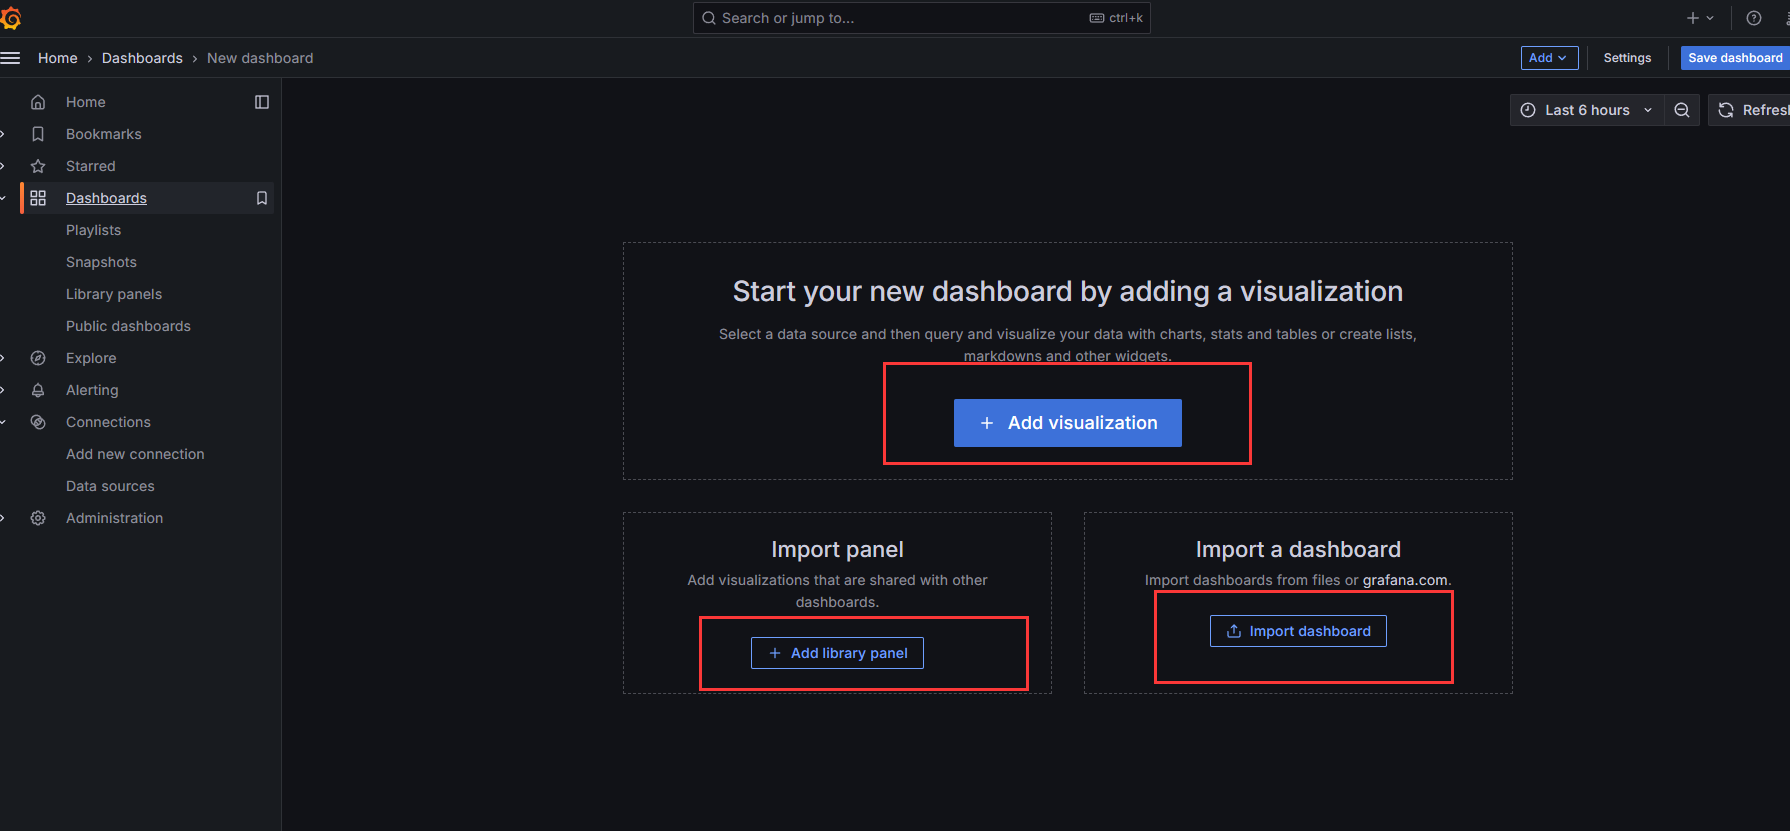
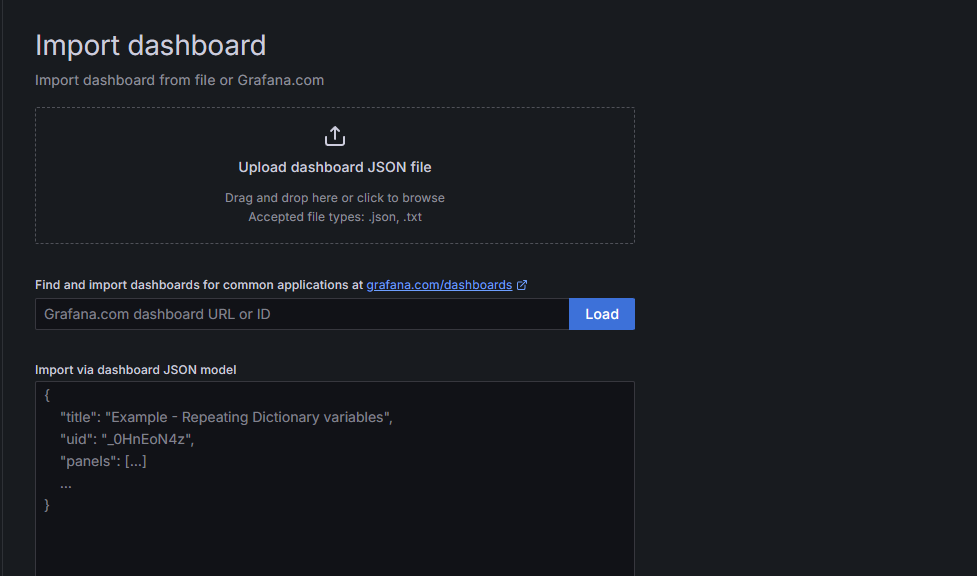
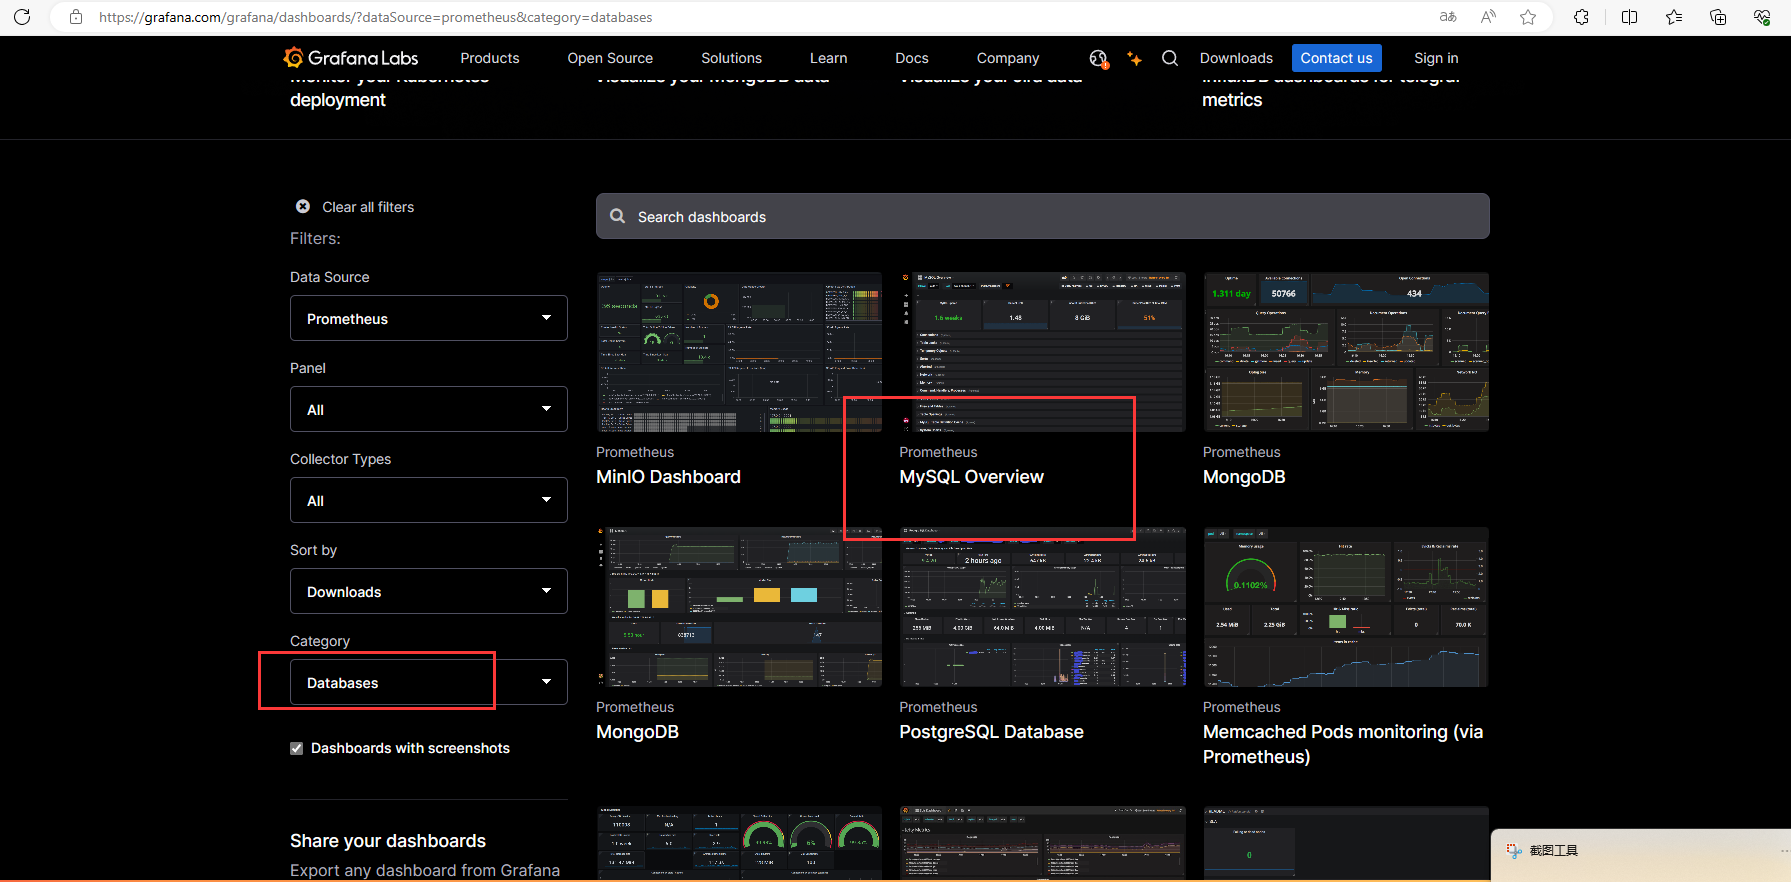
这里有多种方式可以建仪表盘,可以导入,也可以自己新建,当然导入别人弄好的比较方便
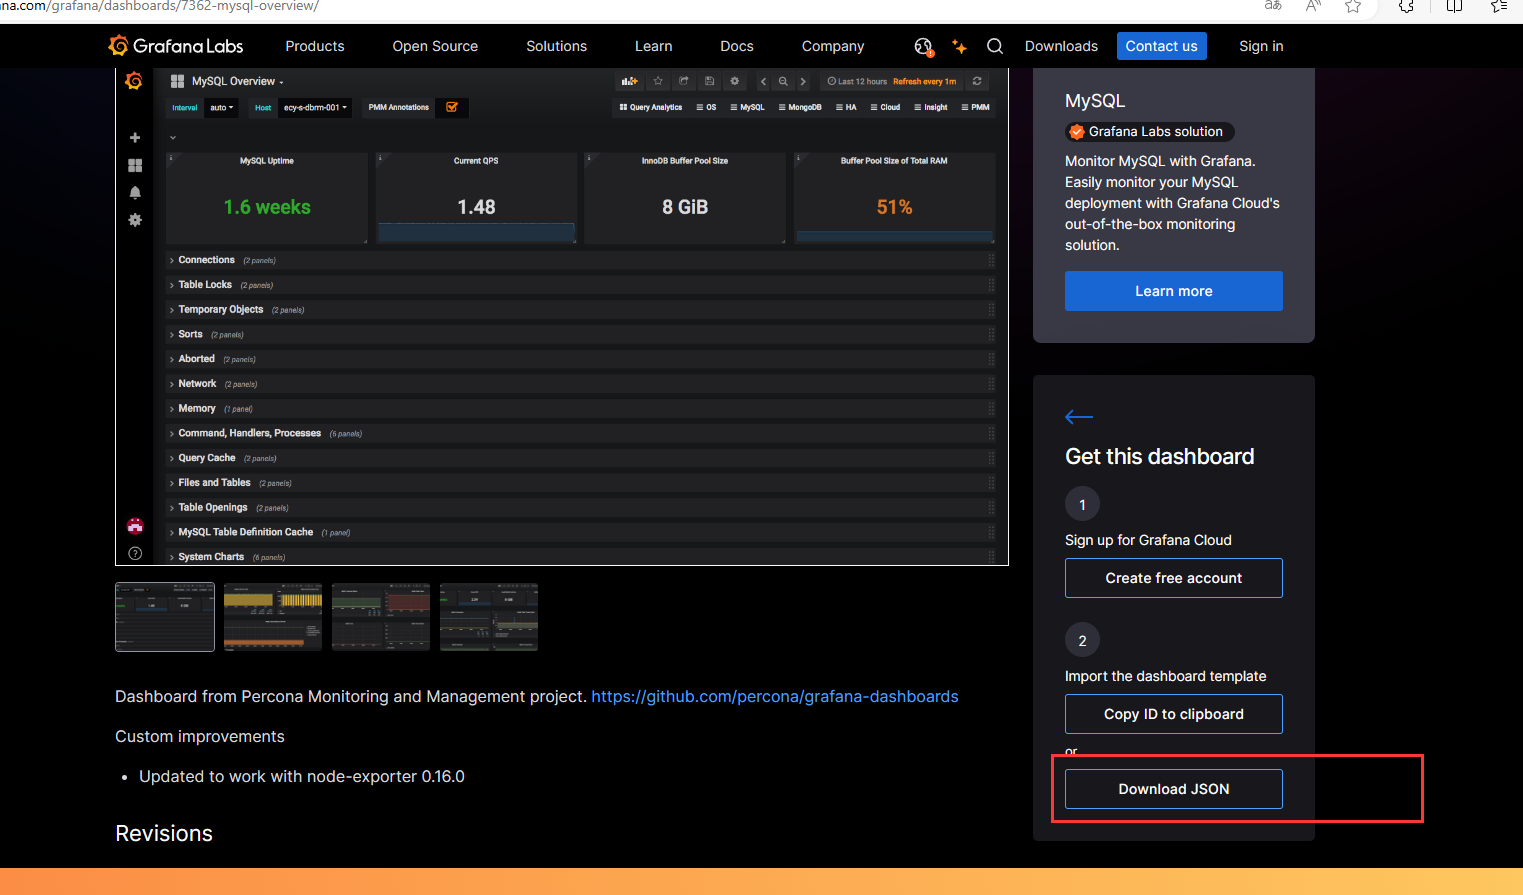
比如这里选择mysql的
从这里去下载即可。
https://grafana.com/grafana/dashboards/
然后在之前的界面导入即可。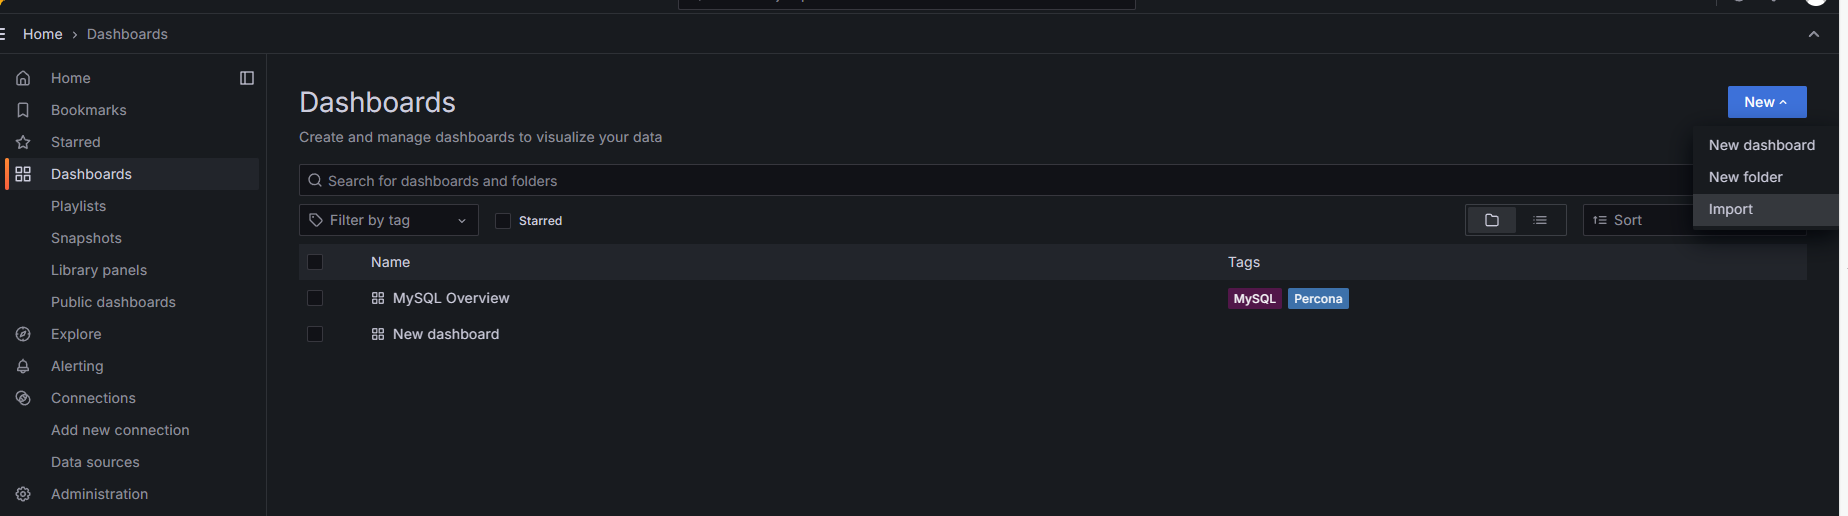
时钟若是没有同步,可能会看不到数据
